EVENTS:   Best Equity Short Ideas Conference Call 12 - Zach Shannon/Corto Capital Advisors & Craig Huber/Huber Research Partners & Thomas Beevers /Forensic Alpha & Ed Steele/Iron Blue Financials & Bill Campbell/Paragon Intel - 12 Nov 25   Will AI Deflate the World? Macro Lessons from Three Industrial Revolutions and China - Manoj Pradhan/Talking Heads Macro - 13 Nov 25     ROADSHOWS: Forest Products Sector Equity and Commodity Research With Expertise in Distressed Debt - Kevin Mason /ERA Research   •   London   12 - 14 Nov 25       Buyside to Buyside Forum and Expert Calls across TMT, Consumer, Healthcare and Fintech - Andrew Peters /Revelare Partners   •   London   17 - 19 Nov 25       Fundamental US Healthcare Short Ideas - Dr Elliot Favus /Favus Institutional Research   •   London   17 - 19 Nov 25      

Fortnightly Publication Highlighting Latest Insights From IRF Providers

Company Research

ONGC (ONGC IN) India

Energy

ChartAnalytics

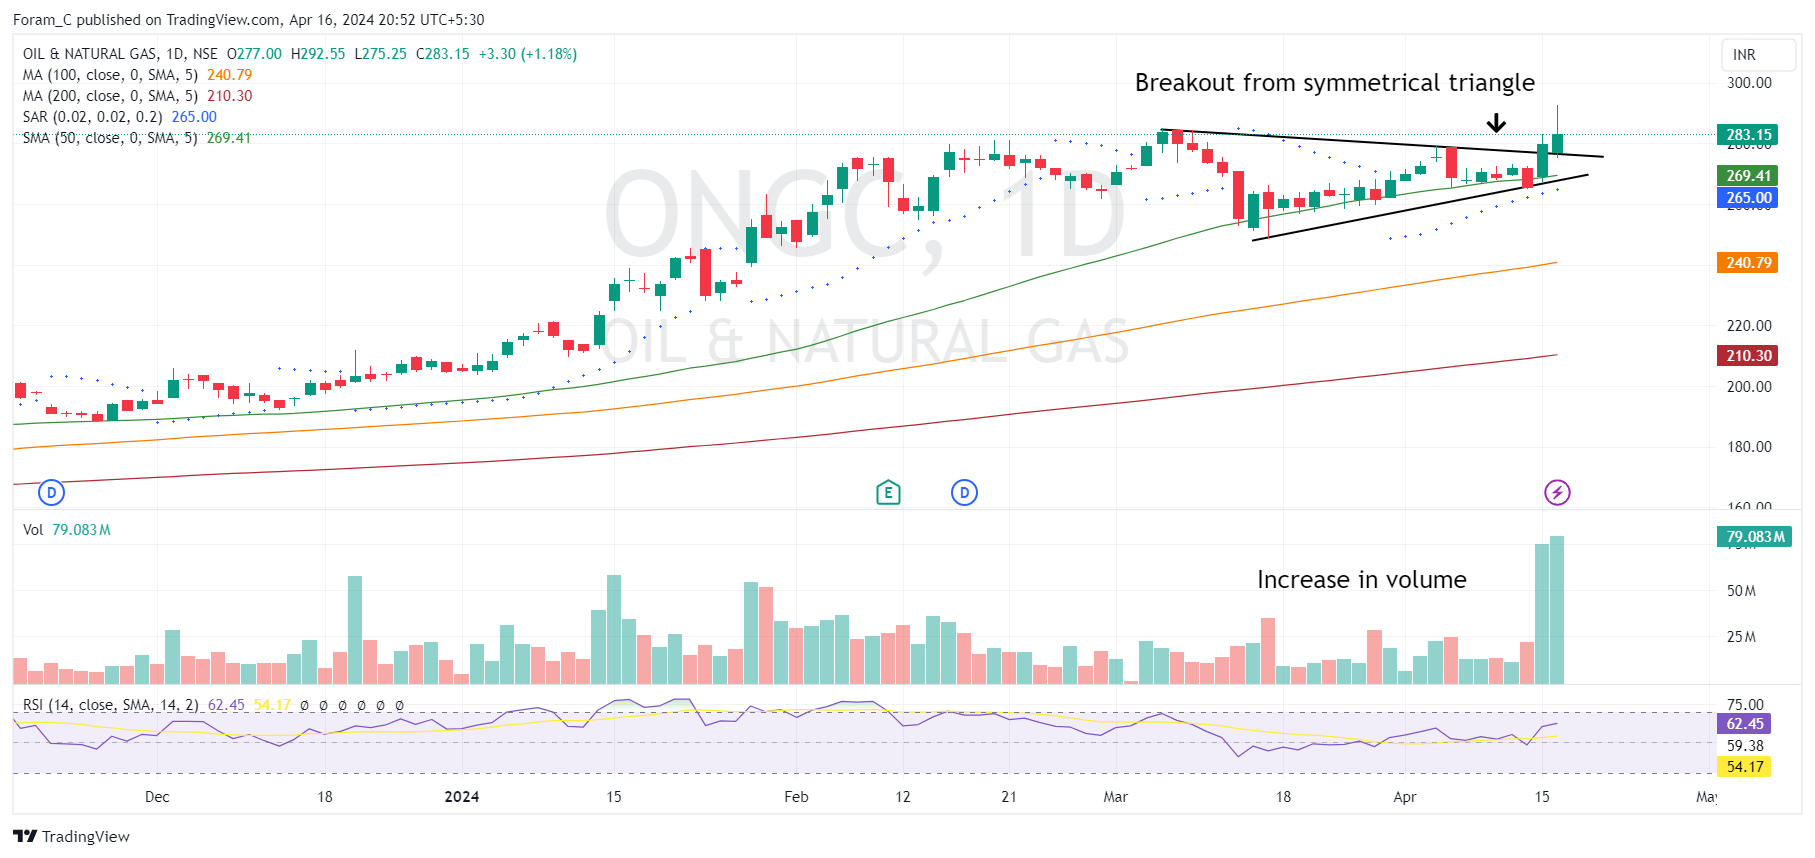
This energy stock is poised for a fresh thrust on the upside - after finding support around the 50-day MA at Rs. 188 in Nov last year, ONGC's stock gradually rose but stalled around Rs. 280 in Feb, undergoing a corrective decline. The decline found support at the 50-day MA, leading to nearly a month of consolidation and forming a symmetrical triangle, a neutral pattern indicating potential continuation. A breakout from this pattern recently occurred with an exceptional volume increase, indicating bullish sentiment. The stock is expected to gain momentum towards Rs. 320. Any price below Rs. 267 suggests exiting the stock.

Edition: 184

- 19 April, 2024